Coronavirus – If you don’t measure it, you can manage it

It’s been interesting over the past weeks and months to observe the different approaches taken by countries in response to the Coronavirus pandemic. Several countries such as the UK and US have been providing CoVID-19 data at a granular level, enabling their populations to stay much more accurately informed. For example, the UK health department has been very transparent with their data regarding where the coronavirus cases are located, by area/postcode. This allows for more effective management and planning.

Innovative workarounds have been developed in Australia, (such as SnewPit and AIBuild), but it’s a shame that in Australia we’ve had to resort to approaches such as reverse engineering geolocation data by scraping social media feeds, to be able to more accurately map information related to CoVID-19.

While the current situation raises some data governance/ethics questions, it’s interesting that European countries governed under legislation such as GDPR have been more open with their data than Australia.

As we say in business, “if you don’t measure it, you can’t manage it”. Better access to more timely, more accurate, information invariably leads to better decisions.

With better access to data similar to that provided by other countries, data experts can provide local communities with much better information, which could help reduce the sense of panic and frustration being caused by state and federal government’s sometimes confusing messaging and misinformation.

The data visualisations below were built using some datasets recently released by the NSW Government. While this data is by no means perfect (I uncovered numerous data quality errors while building these dashboards), it at least a start, allowing us to keep our local communities more accurately informed.

Note: the base COVID-19 case data was enriched by adding Australian Bureau of Statistics demographic data (Census 2016), including population, median age, median weekly income to help identify, for example, ‘at risk’ suburbs (suburbs with a high proportion of the population over 65)

Smart Cities: from Hype to Action

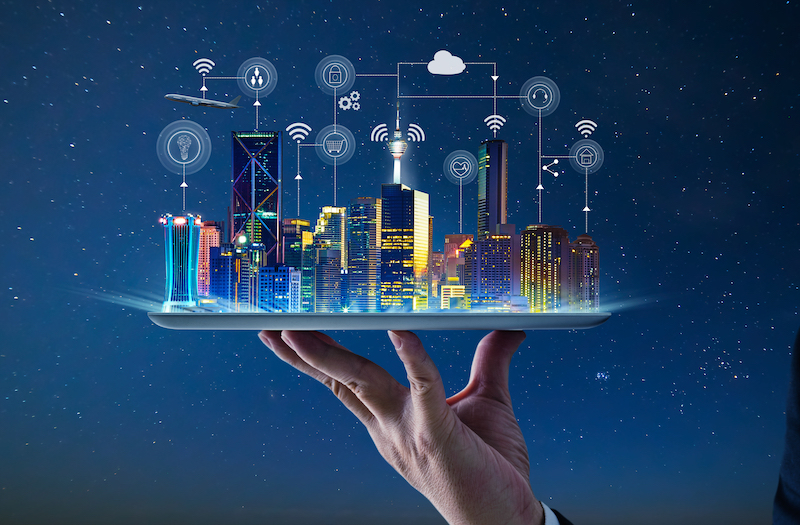
We’ll never live in the Smart Cities of tomorrow if we continue to rely on the technologies and infrastructure of yesterday.

Data has surpassed Oil as the world’s most valuable asset. 3 out of 4 jobs will soon require some level of technology skills – and children in disadvantaged areas without access to the latest technology will continue to fall further behind – the digital divide. This has major implications for Smart Cities initiatives.

At the recent Colorado Smart Cities Symposium, we learned of the growing social divide due to lack of broadband access, with only around 60% in the Denver area currently having access. City population growth only exacerbates the problem, with over 400,000 new residents arriving in the past 6 years.

Smart Cities for All (SmartCities4All.org)

According to James Thurston, Managing Director of SmartCities4All, while Smart Cities initiatives aim to provide social inclusion, most are actually increasing the digital divide, due to lack of focus around accessibility, particularly as it relates to accessibility for persons of disability and older persons.

In order to create smart cities and regions, CIOs need to leverage data and technology while also implementing programs that promote community engagement to help make citizens’ lives better and boost economic development. Many Smart Cities aim to leverage real time open data driven solutions and take advantage of disruptive new technology in transport, communications and energy efficiency, to grow the economy. However, according to Gartner, 30% of smart city initiatives will be discontinued due to lack of integrated services and data analysis, by 2023.

“Smart city platforms need to extend beyond just IoT platforms to deliver full solutions that encompass citizen engagement and experience, ecosystems, data analytics and AI.” (Source: Gartner Predicts 2019: Smart Cities)

While infrastructure such as fast, reliable and affordable broadband internet is key, it’s also essential to be able to make effective and efficient use of the many sources of data available to feed a Smart City project, and integrate these sources into smart, personalised digital experiences. For example, “Ten Gigabit Adelaide” has been rightfully seen as a game changer, helping make a somewhat isolated city, struggling to attract investment, tranform itself to be globally competitive. As Peter Auhl, the driving force behind the initiative, commented: “This world first infrastructure is showing the impact digital infrastructure can have on an economy and a city”.

Yet many Smart City CIOs are still struggling to pull together all the disparate sources of data (IoT, Open Government Data, internal data, 3rd party data e.g. Strava data, Weather data, sentiment data, survey data etc) and present it in a seamless digital experience for internal and external users. 

In an ideal world, integrated digital experiences – for citizens, agencies, employees would just work – securely, seamlessly, functionally, and with delight. But they don’t. Instead, most Smart Cities have a growing problem of too many systems and silos, redundant or overlapping tools and data, and compounding communication challenges because of the “systems of chaos”.

No Smart City is immune to this challenge – and all Smart City CIOs wish vendor to vendor systems worked better together.  

Aloha Cloud for Smarter Cities - distributed real-time data and collaboration digital experiences

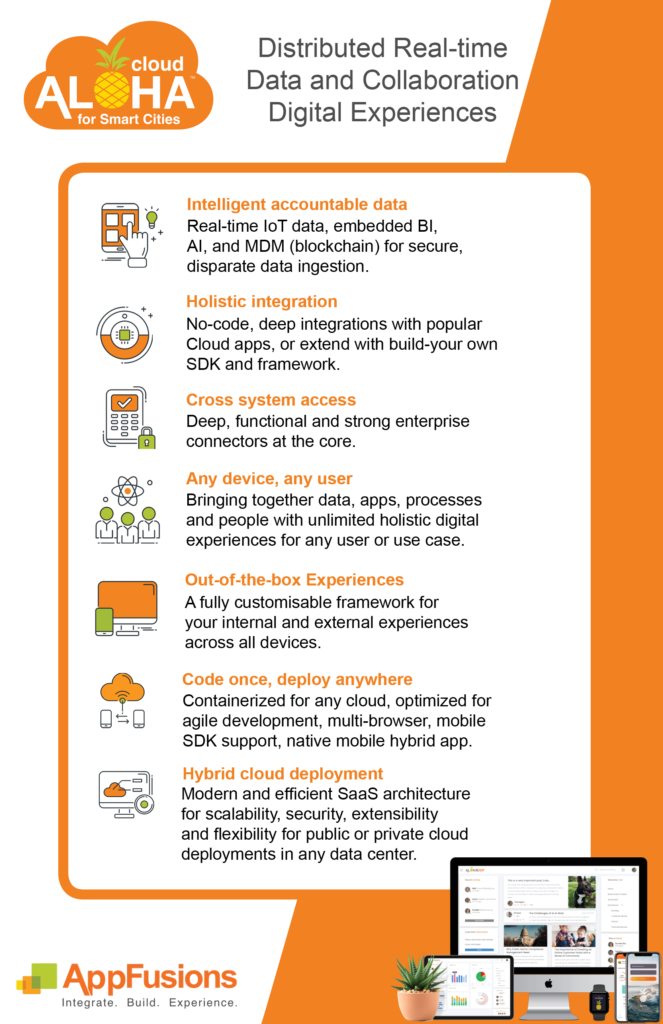
This is where AppFusions can help. The AppFusions AlohaCloud platform addresses these issues by providing dynamic, real-time, collaborative digital experiences incorporating enterprise-grade blockchain (including seamless SSO/authentications where required).

The AlohaCloud platform is unique in that while addressing the Data side of the equation through deep integrations for realtime IoT data, Open Data etc, it also incorporates a full Digital Workplace (DWP) for Collaboration.

This provides data-driven, fact-based collaboration with context. Particularly in the current environment of “fake news” and alternative facts, it’s now more important than ever for Smart Cities initiatives to be accountable, measurable, auditable.


Smart Cities need to become ‘collaborative, innovative problem solvers’. As Professor Gary Hamel commented: “The problem with the future is that it is different. If you are unable to think differently, the future will always arrive as a surprise”.

A great example of “thinking differently” is the US Department of Energy in Idaho, which has a vision to provide clean, secure connected transportation, addressing critical zero-emission transportation system challenges (e.g. grid capabilities and charging strategies). The 10-20 year strategic objective is to demonstrate Autonomous, Connected, Electrified and Shared mobility transportation solutions. A short term goal is to provide a bus electrification management system digital experience, engaging everyone from passengers and drivers to fleet planners, operators and manufacturers. AlohaCloud is the digital experiences platform powering this visionary initiative.

We will never have sustainable, vibrant and future-proofed local economies unless we embrace digital transformation to equip our local workforces and communities with the skills they need to for the future. AlohaCloud enables this digital transformation, bridging the digital divide. Making Smart Cities smarter.

We’ll never live in the smart cities of tomorrow if we continue to rely on the technologies and infrastructure of yesterday


We’ll never live in the cities of tomorrow if we continue to rely on the technologies and infrastructure of yesterday.


Connecting Tableau to SAS Datasets via the SAS OLE DB Provider

(This article was originally published on the see-change.co website)

One of the topics which generated a lot of interest during my presentation on SAS/Tableau Integration at the ‘TCC13’ Tableau Customer Conference, was the idea of connecting to SAS datasets via the SAS OLE-DB Provider. While SAS themselves refused to allow such a presentation at their own customer conference…, it was unexpected as much as rewarding to find an audience of around 150 people at a Tableau conference interested in SAS connectivity!

Currently, Tibco Spotfire is the only 3rd party Data Discovery tool I’m aware of, which natively supports OLE-DB connectivity to SAS datasets. The benefit of OLE-DB is that it does not require access to SAS Server in order to connect to a SAS dataset. This is important, because often SAS datasets are stored locally or on a network share. SAS ODBC requires SAS Server connectivity, which in turn requires SAS client/server connectivity (eg SAS Integration Technologies)

A workaround is to connect to SAS datasets via OLE-DB using Excel as a ‘gateway’. Since the OLE-DB connection definition dialog is fully exposed within Excel, the connection details to the SAS dataset can be set up and tested. Then Tableau can be pointed to the Excel file, through which the SAS data can be retrieved.

Since the OLE-DB connection provides a way to automate the refresh of the SAS data from within Excel, this method can help ensure that the Tableau workbook is kept up-to-date as the underlying SAS data changes.

To follow are the steps to set up the Ole-DB connectivity.

Step 1: Define OLE-DB connection within Excel
Open up a blank Excel workbook. Under the ‘Data’ menu, select the option ‘From Other Sources’ then select ‘From Data Connection Wizard’:
Excel_to_SAS_1
Step 2: Select the Base SAS Data Provider
In the Data Connection Wizard, select ‘Other/Advanced’ then click Next:
Excel_to_SAS_2
Select the SAS OLE-DB Provider (9.2 or 9.3 as appropriate): Excel_to_SAS_3
Step 3: Define Connection Properties
The next step is perhaps the least intuitive. The ‘Data Link Properties’ dialog requires a connection to be defined to the SAS data set. For this to work correctly, all that is needed is the path to the folder where the SAS datasets reside. This is entered into the ‘Data Source’ property. The other options such as ‘Location’ and ‘User name’ can be ignored.
Test the connection, then click OK.
Excel_to_SAS_4
Step 4: Select the desired SAS dataset to connect to Excel_to_SAS_5

Step 5: Save the Data Connection Excel_to_SAS_6
Step 6: Import the data Verify that the OLE-DB is working as expected by importing the SAS dataset into Excel via the OLE-DB Provider connection which has just been defined:
Excel_to_SAS_7
Step 7: Save the Excel spreadsheet containing the SAS OLE-DB Connection Excel_to_SAS_8
Step 8: In Tableau, Connect to the Excel File Select ‘Connect to Data’, then select ‘Microsoft Excel’. Select ‘ Live Connection’.
Excel_to_SAS_9

When the Tableau workbook is saved, the SAS data can be refreshed by periodic refresh of the Excel connection. This can be scheduled to ensure that Tableau is retrieving the most up-to-date information from SAS.

Here is a video demonstrating the process described above (sorry, no audio):

Setting up SAS dates for input into Tableau Desktop

(This article was originally published on the see-change.co website)

Some techniques for setting up integration between the SAS and Tableau solutions, specifically with respect to date formats.

SAS and Tableau are ‘best of breed’ in their own areas – SAS in the area of Analytics and ‘Analytical Data Preparation’, Tableau in the area of data visualization and interactive dashboarding in an intuitive, drag & drop environment. Consequently, it makes sense to find ways to integrate these technologies to provide an Integrated Information Framework which leverages the strengths of both solutions.

Leveraging SAS capabilities in this way provides a way to ‘rapid prototype’ business reporting requirements, without the costs and delays typically seen when attempting to model emerging business requirements in the Data Warehouse via traditional ETL methods.

In addition, this approach suggests a way to protect the investment in analytical reporting as developed by the SAS team, by providing a platform to publish those reports for easy consumption, plus easy re-formatting and ‘slice & dice’ of these reports in the Tableau environment

Example
Typically, the easiest way to prepare SAS data for consumption in Tableau is to set up an export process in SAS Enterprise Guide:
Tableau_Test_1
Using the SAS Enterprise Guide Export wizard, a SAS dataset can be exported as CSV, as a step in the process. Dataset is exported to a network location. SAS process looks like this, and can be set up to run on a schedule eg monthly.

In this example, we have a number of dates in our SAS dataset:
Tableau_Test_1c
Often, the default date format as set up in SAS is adequate to be imported into, and correctly interpreted by, Tableau.

Where this is not the case, the SAS date format ‘DDMMYYS8.’ can be used:
Tableau_Test_zerob
Which would produce SAS code similar to the following:

PROC SQL;
CREATE TABLE
WORK.QUERY_FOR_POLICY1 AS
SELECT t1.trandate FORMAT=DDMMYYS8.,
t1.polexpdt FORMAT=DDMMYYS8.,
t1.commdate FORMAT=DDMMYYS8.
FROM WORK.QUERY_FOR_POLICY t1
QUIT;

On importing the dataset into Tableau, the dates are correctly interpreted, automatically providing the ability to drill from Year to Quarter to Month:
Tableau_Test_3b
Note: While it is generally easier to prepare the data in the most appropriate format for Tableau using the extensive SAS’ data functions and formatting options, there are also date functions within Tableau. For example, to convert a text (string) field containing dates in the format YYYYMMDD into a date within Tableau, the following could be set up as a calculated field:

Date(right([PERIOD],2) + “/” + mid([PERIOD],5,2) + “/” + left([PERIOD],4))

Summary
In addition to the approach described above, another way to ‘prepare’ SAS data for consumption in Tableau involves using the SAS ‘PROC SQL’ method to output SAS results directly to a relational table. With the SAS/ACCESS interface, database objects can be referenced directly in a DATA step or SAS procedure using the SAS LIBNAME statement. PROC SQL can be used to update, delete or insert data into a relational table, for example via Bulk Load.