The Need for Speed

At a Big Data conference recently, IBM presented the following slide:
IBM - Big Data

Interestingly, IBM also predicted that 1/3 of consumer data will be stored in the Cloud by 2016, and that 80% of new apps will be distributed or deployed via the Cloud. (IBM also once famously predicted that there would be a world market for 5 computers, which will perhaps one day be viewed as equally laughable as the Australian Prime Minister’s recent assertion that 25mbps Internet speeds are “more than enough”…)

The implications of Cloud Computing + Big Data are: exponentially more Internet traffic and therefore a need for faster, better, more reliable Internet services. A “Big Data Explosion” is certainly underway, and the implications for technology infrastructure are clear, as I attempted to illustrate with this graphic.

Big Data Needs

As discussed previously (in The Law (and Danger) of Averages), the problem with statistics, such as averages and medians, is that they are often misunderstood, and can be misleading. For example, if I have my left foot in the freezer (0 degrees) and my right hand in the fire (1000 degrees), and my body temperature is 40 degrees, then what temperature am I? Am I ok? My average temperature could be calculated as (0 + 40 + 1000)/3 = 347 degrees. My median would be (0, 40, 1000) i.e. 40 degrees. In this case the average indicates that we have a problem, the median does not.

So, in the case of so-called ‘median internet speeds’, what does this mean? Well, it depends on the methodology used to calculate the median. How was the measurement taken? When was the measurement taken? If it was taken at 5pm on a weekday, that would be different to if it was taken at 3am on a weekend, for example. Without such information, the measurements are pretty much useless for drawing any meaningful conclusions.

This is how ‘median ADSL speed’ is actually calculated on the much maligned “myBroadband” website:

“The column ADSL_SPEED_MEDIAN refers to the statistical median of the modelled peak download ADSL speed for each premises within a given DA. The specific speed measure that has been modelled is the line sync speed which refers to the cable distance between the relevant exchange or street cabinet and an individual premises. Other factors, as detailed in the Broadband Availability and Quality Report will also affect real world download speeds.”

So the fact that the actual signal gets slowed down by muddy, flooded pits and deteriorating, degraded copper is not reflected in these numbers. The fact that the signal is actually leaving the exchange via a ‘remote integrated multiplexor’ (sub-exchange), which slows the data down from 22mbps (ADSL2+) to 1.5-8mbps (ADSL1) is not reflected in these numbers. Talk about mis-representation of the data. It would appear that Australia’s entire broadband ‘strategy’ is being run along the lines suggested recently by Dogbert:

Dogbert on Dashboards

Dogbert on Dashboards

I was therefore very pleased to have stumbled across this crowdsourced survey of actual ADSL measurements, which formed the basis of a submission to the Senate Select Committee Hearing into the NBN (National Broadband Network – sometimes disparagingly referred to as the NBNNNNN i.e. “National Broadband Network – Not National Non-Network”). The team behind this excellent submission were more than willing to provide the raw data, which I turned into the following set of data visualisations:

When it comes to the Internet, everyone’s an ‘expert’ and everyone certainly has an opinion. However not all opinions turn out to be correct:
"I think there is a world market for maybe 5 computers" (IBM Chairman Thomas Watson, 1943)

Hence the need for technologies such as Business Intelligence and Data Discovery tools, which aim to support “informed, fact-based decision making”. While that will not stop people from turning a blind-eye to the truth, particularly when it’s an “inconvenient” truth they would maybe rather deny, at least it gets the truth out there. (Hurrah for crowd-sourcing, social media and “Open Data”…)

Innovation

I was recently asked by a Rocket Software Business Partner, Pentana Solutions, to give a talk on the topic of “Innovation”. Specifically:

How do companies promote innovation
How do companies create a culture of innovation
How do companies prioritise and manage the Business As Usual Vs. Innovation

At first, I was a little perplexed. What do I know about Innovation? However, as I mulled over the topic, I saw parallels in my own work and home life. At work, in Rocket’s Sydney R&D Lab, we are innovating daily to build a truly user-focused, self-service, Cloud/mobile-enabled data discovery & exploration solution for our customers. At home, I struggle daily with the challenges posed by a study of jazz guitar: creativity, improvisation, innovation.

The first ‘lesson’ I considered is summed up by the words of educationalist Sir Ken Robinson, in a recent TED talk: “If you’re not prepared to be wrong, you’ll never come up with anything original“. Or as my jazz guitar teacher says, “Letting Go” – letting go of fear and inhibitions. Creating a culture of trust, removing or reducing fear of failure, creating an environment when team members feel empowered to think “outside the box”, these are all key elements to promoting originality, which leads to innovation. This ‘culture’ needs to be enabled at the individual level, at the team level, and at the organisation level. For the latter, the organisation needs to consider it’s ‘brand’, the image it wishes to portray. A stodgy, outdated website, or bureaucratic hiring processes are not going to attract the kind of “creatives” you want to employ in the first place: people with an aptitude for creative thought, a passion for innovation and change.

When Steve Jobs talked about his Macintosh development team at Apple, he talked about “..musicians and poets and artists… who also happened to be the best computer scientists in the world”. He talks about “trying to expose yourselves to the best things that humans have done”. Get out of the office, take a walk, get inspired by the ideas of others, mix things up..

”Habitual thinking is the enemy of Innovation”

(Prof. Rosabeth Moss Kantor, Harvard Business School)

“It’s not where you take things from – it’s where you take them to.”

(Jean-Luc Godard)

Another important consideration is that Innovation can come from anywhere – it’s not just about product. Any process, any service can be improved. Sometimes the small things get overlooked, but innovative thinking couldInnovation Slide yield big improvements in unexpected areas. Be open-minded and willing to challenge perceptions. As Nolan Bushnell comments in his book “Finding the Next Steve Jobs”, Neutralize the Naysayers (“any idiot can say no”)

One often overlooked aspect of innovation is the thinking process itself. A great way to create ‘space’ for innovation is to give people time to think. Treat is as  part of everyone’s job, make it a KPI. “Hackathons” and “Innovation Jams” are great, but innovative thinking should become part of everyone’s default thought process: how can this be improved? Allocate time for the thinking process. People like to create, like musicians with a tune in their heads. Our job is to capture and focus this creativity. Give space to people. We need to orchestrate, provide a vision, then allow the creative ‘juices’ to flow.

Another key to allowing this ‘culture’ of innovation to flourish is, of course, hiring people with an aptitude, attitude or predisposition towards creative thinking. Hire for passion and intensity. For example, when we hire front-end developers at Rocket, we don’t just look at javascript test scores, we look for passion, energy, creativity. Does the candidate want to be challenged? Is the candidate comfortable having an opinion? Does the candidate show initiative, intuition?

Simplicity

”Innovation is a state of mind”

(James O’Loughlin, The New Inventors)


Simplicity

A key area when it comes to Usability and User Interface Design, is Simplicity. Over the 20+ years I’ve been working in the Business Intelligence industry, it’s often seemed like simplicity has been the last thing on the software vendor’s minds. Yet when attempting to design a product for an end-user, self-service audience, rather than a ‘tech-savvy’ or IT audience, intuitive usability is critical. If a 4 year old child can use an iPad intuitively, why should a 40 year old executive have to struggle with some counter-intuitive, poorly designed piece of business software? It doesn’t make sense.

In John Maeda’s book ”The Laws of Simplicity”, he comments  “Simplicity is about subtracting the obvious, and adding the meaningful”. Simplicity is about clarity, brevity, refinement, restraint.

UXdrivenInnovation


Simplicity is the ultimate sophistication” (Steve Jobs)


“What is sought in designs is the clear portrayal of complexity…” 

“…not the complication of the simple”

Edward R. Tufte, The Visual Display of Quantitative Information


Rocket Software constantly questions, reevaluates and revalidates its assumptions, talking to customers and partners, clarifying their assumptions and needs. We try to assume nothing. And as we continue to develop exciting new products such as Rocket Discover, I personally try to keep the following thoughts top of mind:

Inspire yourself to inspire others
Challenge the status quo
Suspend disbelief and cynicism: Believe in the art of the possible
Empathize – Listen – provide a ‘context to create’
Empower the team

EinsteinQuote

The parallel between software design and music

As an aspiring jazz guitarist with a lot of musician friends in the software industry, I often reflect on the parallels between software design/development and music. For example:

  • how the “workflow” of product design should be harmonious and keep a relationship “to the tonic,” i.e. the objective of the tool or task remains clear;
  • how jazz musicians innovated to create new musical approaches, as we innovate to create new software products and new approaches to solving business problems;
  • how we try to minimum “boredom” in user interface design by minimizing needless mouse clicks, as musicians try to keep the audience engaged.
By way of example, I read the following comment in an email about music a while ago: “Turnarounds started when jazz players became bored with chords that lasted for two bars or more.” (This made me laugh! As the joke goes, a rock musician plays three chords to 3,000 people; a jazz musician plays 3,000 chords to three people). The email went on to say “These players thought up new ways to take a long tonic chord and play other chords on top of it to take the harmony to a different place.”
giantsteps-smallAs described by the ‘Completion Principle’, people almost involuntarily seek to complete that which is not complete.

When something is certain and known then we feel comfortable and in control. When something is not complete, we cannot close that item in our mind as we have to keep thinking about it.” (Changingminds.org)

Music itself is often a play on an audience’s desire for “completion,” hence the concept of “tension and release” introduced by common harmonic structures such as the II-V-I, which “resolves” back to the I chord (or the V-IV-I in blues).autumn-leaves-small

Interestingly, what is considered musically “acceptable” has changed over the years. From at least the early 18th century, one interval was actually referred to as the devil’s chord: “Diabolus in Musica” (the devil in music), what we now call the tritone or flat 5 (diminished 5th). Perhaps equivalently, it wasn’t that long ago that business software programs were often designed for “experts” rather than laymen, with little consideration to usability or intuitiveness. The concept of a “self-service business intelligence” product was almost an oxymoron.

Yet thinking about features and not about flow (workflow) is akin to thinking about scales and modes, and not about the underlying harmony and melody. Having a bunch of loosely coupled UIs or “studios” is a little like having a bunch of musicians playing who are playing for themselves and not each other, who are not in tune with the rest of the band.

It is certainly just as important to understand the form/structure of a tune as it is to understand the overall structure of a software solution. Usability design (UX) without an understanding of form and function (business needs/problems) is perhaps the equivalent of elevator music.

Once the form (concept, requirements) is/are well understood, however, then good developers can be trusted to improvise and innovate. Similarly with good musicians. Here is a tip I got from a great jazz guitar teacher, Jody Fisher (in relation to creating improvised lines between chords):

chinese_symbols_for_innovation_9599_2_40“You know, you can play almost ANYTHING to approach the next chord; you’d be surprised how freeing this can be…It works because any note has some relationship with any chord–of course it’s a matter of taste…”

In our world, I think this has parallels with giving developers “freedom to create” (or “fail-fast”). “Fast failure” is the new culture driving innovation: being afraid to fail kills ideas. Interestingly, innovation means create-new (Chueng Xin) in Chinese.

What is more important, essence or perfection? Comparing waterfall vs agile development could be analogous to comparing classical vs jazz. Classical has detailed “requirements,” painstakingly developed via the score, which is played as written. Jazz is more free-form, a general idea/form (theme) which is then built upon through improvisation (iterations/sprints).

My friend Adam Rafferty, who studied with Mike Longo (former pianist and musical director for Dizzy Gillespie) ,recently wrote about how Mike described the difference between “How To Play” and “What To Play.”

“How To Play” “What to Play”
1.Touch                                            2. Time
3. Tone
4. Technique
5. Taste
 1. Harmon
2. Melody
3. Rhythm
4 Counterpoint
5. Form

Adam suggests:

“What to play” can generally be written on paper in a book form – it’s “information” much like a cookbook.
“How to play” is a bit more elusive…some chalk it up to “feeling” but it’s much more than emotion. It’s intuition and experience.

Similarly in software development. Concepts (harmony), such as “material design,” or architecture (form) such as the “MEAN stack” are the building blocks, but it takes intuition and experience to turn these into elegant software. In fact, it’s sometimes “how to play” can equate to “what not to play.” As Miles Davis once said “it’s not the notes you play; it’s the notes you don’t play.” In his book “Simplicity.” John Maeda comments:

“The simplest way to achieve simplicity is through thoughtful reduction” (John Maeda, ”The Laws of Simplicity”)Simplicity

In my R&D lab we often talk about “simplifying complexity.” It’s much harder to make the complex seem simple than it is to make the simple overly complex. Hence the brilliance of someone like my favorite guitarist, Wes Montgomery.

The great Zen teacher Shunryu Suzuki wrote: “In the beginner’s mind there are many possibilities, but in the expert’s there are few.” Regardless of how much we learn or how expert we become, we can benefit from seeing ourselves as beginners. Keep an open mind. Think “outside of the box.”

To finish with an (alleged) quote from the infamous Yogi Berra:

“Anyone who understands jazz knows that you can’t understand it. It’s too complicated. That’s what’s so simple about it.”

And so it may be with good software design…

Summertime-small2

How Social Business Solutions Power Collaborative Analytics

To a greater or lesser extent, everyone collaborates.

I watch my two-year-old twins collaborate daily. I listen to the “collaborative creativity” within a jazz ensemble. Yet so often in a work context we operate in silos.

For decades, the silo of choice was the spreadsheet. Today, it’s becoming the data discovery “workbook.” Yet it’s no longer enough to just have meaningful analytics: it’s also about speed.

When Steve Jobs talked about his Macintosh development team at Apple, he talked about “…musicians and poets and artists…” He talked about “trying to expose yourselves to the best things that humans have done.” In other words, getting inspired by the ideas of others. Collaborating.

Consider how musicians collaborate: they predict, perceive, and react to what their fellow musicians do in complex ways. Collaboration is about listening to others and connecting to their emotions or intuitions. Collaborative Business Intelligence is about communicating a story with the data. Communicating the meaning behind the numbers. The numbers are the notes, in time and space. Harmony. Melody. Rhythm.

So what is Collaborative Business Intelligence? According to Howard Dresner, it is “a process where two or more people or organizations work together to develop a common understanding, which is shared and used to build consensus in support of organizational decision making.” Collaborative capabilities include sharing, annotating and co-authoring of business content.


Recent research defines several distinct types or styles of collaboration, including:

  • Distributed Collaboration – informal collaborations based on common interests
  • Complimentary Collaboration – based on complimentary expertise, knowledge and/or roles
  • Integrative Collaboration – collaborative development of a new concept or idea, which no individual could have conceived of on their own

The latter is commonly seen in the context of jazz improvisation, and often in the workplace where Agile principles have been adopted. Development of new ideas, through integrative collaboration, is a powerful way for an organization to foster a culture of Innovation.

People are the heart of business

People are the heart of business

It’s the same in a business context. People are at the heart of business. And Collaborative Analytics, or Collaborative Business Intelligence, is about putting the Business into Social.

Annual revenues for vendors in the Collaboration space are predicted to break $4.5 billion by 2016, and the Enterprise Collaboration Market is projected to be worth $70.61 Billion by 2019. That is significant growth.

In fact, recent research shows Social as the fastest growing segment of the Enterprise Collaboration market, with a projected CAGR over 18% – a trend which is projected to continue for several years. This is perhaps unsurprising considering how social and ‘tech savvy’ the workforce is becoming.

Consider how well-versed our teenagers, the next generation of knowledge workers, already are with social concepts, such as Facebook and WhatsApp. In recent product usability testing, we found that a 15-year-old high school student was able to immediately grasp collaborative BI concepts such as sharing and discussing dashboards via integrated chat, with little or no training.

As Howard Dresner commented, “Insight built collaboratively adds value faster and achieves faster consensus and better buy-in.” This in turn can help drive better organizational alignment to strategy and goals. It comes down to inspiring, motivating and empowering business users with a passion to help the organization drive better business outcomes for customers and shareholders.

Imagine the following scenario: members of a finance department are collaborating on a new budget. Having blended data from both internal systems as well as external data (for example, projected interest rates or customer demographic data), they seek feedback and collaboration from other managers in the business. They push a dashboard to an internal ‘community’ of managers on their Enterprise Social Platform, and engage in a dialog with those business users around market sentiment, budget assumptions and so on.

This information is captured in the Collaborative BI system, to provide an audit trail for subsequent decisions. Thus avoiding the perpetual issues with emailing static documents and spreadsheets with cell-reference and other common errors, making governance almost impossible.

So what does this mean for the future? What I expect to see is a trend towards solutions which help organisations get better at measuring outcomes, improving accountability in support of evidence-based decision-making. In recent years, the Business Intelligence market has strayed towards what Gartner Research sometimes refers to as the “wild, wild west” of siloed, ungoverned business data, causing “multiple version of the truth.”

An era of social business solutions powering a more collaborating analytical process would certainly be music to my ears.

As long as it’s jazz.

Putting the ‘business’ into ‘social’

Traditional BI ‘collaboration’ is one-to-many e.g. publishing infographics to a website or emailing a PDF – it’s like running a webinar where the participants are on mute (‘listen only mode’).

The future of collaborative BI must evolve to ‘many-to-many’ – including abilities for co-authoring of BI content, as well as co-consumption, annotation, discussion, sharing, editing. The basis of innovation is being able to build upon the work of others, contributing to the ‘body of knowledge’. Collaborating, in other words.

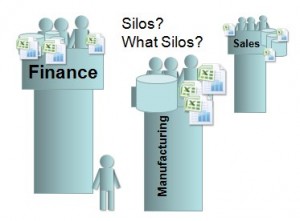
Yet historically, too many people, particularly those involved in Governance of BI systems, have essentially been ‘anti-collaboration’. Which has, ironically, made the situation worse by encouraging users to find ‘work-arounds’, resulting in, for example, the proliferation of spreadsheets. As Boris Evelson of Forrester Research recently commented to me in an email on this topic, “We increasingly hear from our clients that BI silos are now proliferating.  Basically these  platforms are now becoming the new spreadsheets”

The combination of Enterprise Social platforms such as IBM Connections with more modern Cloud-ready, mobile enabled, self-service BI tools helps move better decision making into the line of business, moving towards an ability to see and manage outcomes in real time. Recent research from Aragon Research suggests that, by the end of 2017, 75% of business will be harnessing mobile collaboration, helping to provide real-time analytics for the team, and embrace agility in the workforce.

The key to Collaborative BI is speed. Speed to a decision. Having better, more informed, fact-based conversations with the right people. As the Irish playwright G. Bernard Shaw famously commented:

”…if you have an idea and I have an idea and we exchange these ideas, then each of us will have two ideas.”

Or, at the very least, we have one, better, idea.

And, to finish with one final thought I recently received from my favorite BI Analyst, Howard Dresner:

”One piece of advice for Collaborative BI. Stop using email!”

BI Governance in the world of Self-service Data Preparation and Data Discovery

Self-service BI platforms provide significant benefits, however, they have also contributed to a new trend: the “wild wild west” of proliferating BI silos, inconsistent business definitions, no data lineage, no single version of the truth.

“Spreadsheet hell” has been replaced with “Self-Service BI hell”.

As Boris Evelson (Forrester Research) recently commented to me via email: “We increasingly hear from our clients that BI silos are now proliferating.  Basically these platforms are now becoming the new spreadsheets”.

And that introduces risk. In a recent article in The Economist (“Excel errors and science papers”) it was reported:

“…they had accidentally omitted five rows of their spreadsheet when calculating an average. When included, the missing figures weakened the paper’s conclusion substantially.”

OMG.

Self-service is all about speed and agility, allowing business users to follow their own intuition, answer their own questions, rather than having to rely on IT. In the 1990’s, we used to call it the “next question dilemma”: It’s impossible to predict the next question a business user is going to ask, until they’ve seen the answer to their previous question. Collaborative, self-service data discovery needs to be iterative, exploratory.

But can the “need for speed” in business decision-making be reconciled with the need for Governance? According to Howard Dresner, Governance of BI content creation and sharing correlates strongly to success with BI, improving information consistency and accelerating group-based decision making.

In this context, “BI Governance” includes things like BI lineage, impact analysis, facilitating collaboration and content reuse, reducing content duplication. In the BI industry in general, we’ve seen what Wayne Eckerson recently referred to as a “pendulum swing” – away from (over) governed BI to un-governed BI. The pendulum is now swinging back, because business users are now starting to ask questions like:

  • How do I trust the decision being made?
  • How trustworthy is the data? How timely is the data?
  • How do I communicate the decision, the thought process behind the decision, the facts supporting the decision?

An added complexity results from the increasing number of additional sources of information available to a business user. I was recently talking to a customer in the Financial Services industry, who was explaining that they receive data such as AML (Anti-Money Laundering) data from external sources, usually in a flat-file format. The users need to merge/blend these data sources with internal data, in order to produce their dashboards and reports, in support of their business decision-making. Due to the time-sensitivity of the data, the users needed more of a self-service approach to the data preparation, but still have some governance in order to retain confidence in the information being communicated.

In another example, a business user at a Government customer used to complain that the BI content they received had no “context”: what am I looking at? What does this number mean? How was it defined? When was it updated? What is it filtered on? It continues to surprise me, after 25 years working in the BI industry, that most BI output still doesn’t contain this kind of basic contextual information.

Hence, perhaps, the number of business meetings which are still dominated by debates about the numbers, who’s “version” of the numbers are correct, instead of actually making productive, collaborating business decisions.

I’m reminded of something I noticed on a Deep Purple record “Made in Japan”, recorded back in 1971. Ian Gillan, the vocalist, can be overheard asking the sound engineer: “Yeah everything up here please. A bit more monitor if you’ve got it.” To which Ritchie Blackmore, the guitarist, adds: “Can I have everything louder than everything else?”

Without effective, governed self-service data preparation and data discovery, the information becomes noise, trust in the information is diminished, and effective collaboration becomes much more difficult. Everything is louder than everything else.

It takes two to speak the truth – one to speak, and another to hear.” – Henry David Thoreau

Lessons on data analytics from a tween

I recently received a note from my 11 year old son’s maths tutor, which read:

“Jack will be covering Data, specifically: collecting categorical and numerical data thru observations and surveys, Constructing data displays including dot plots, column graphs and line graphs, naming and labelling vertical and horizontal axes, Using scale to determine placement of each point when drawing a line graph.”

“Aha! Welcome to the world of Business Intelligence!” I thought with a smile. Excitedly, I introduced Jack to my veritable library of books on the subject of charting and data visualization, including of course, all my favourites such as “Signal: Understanding What Matters in a World of Noise” by Stephen Few, “The Wall Street Guide to Information Graphics (the do’s and don’ts of presenting data, facts and figures)”, “Data Points: Visualization That Means Something” and many others. With no words and a tweenage look of disdain, he resumed his game of Roblox (Minecraft was no longer “cool” since it’s acquisition by Microsoft, I was off-handedly informed…)

Then, almost in passing, Jack mused: “I wonder how the number of Roblox users by year would look in a line chart…?”

Challenge accepted. A quick Google search, drop the data into a self-service data visualization tool, and we had our answer.

What was quite interesting to me was that he was thinking in terms of the data, wanting to answer a question empirically, and wanting to see the data visually to interpret the results. Now, as I listen to my son in the background, collaborating in real-time with one of his school friends in multi-player Roblox while they chat and interact simultaneously through Facetime, it’s occurs to me that future generations of ‘knowledge worker’ are likely to be much more collaborative and team-oriented, much more visual and data savvy, much less inclined to accept decision-making which cannot be supported by data. Which, of course, reminds me of a classic Dilbert moment:

Couple the inquisitive, knowledge-hungry mindset of our younger generations with the relentless pace of change and innovation, and we can anticipate that our future business users will not be tolerant of poor decision-making or slow time to action caused by the outdated insights provided by traditional analytics infrastructures. Today more than ever, analytics is a key to business success, but it needs simplicity, real-time speed and security: how fast can a user access and blend all the disparate data they need, analyze and share it, then take action, all in a secure and controlled environment? How can we provide solutions which enrich data with context, to build consensus? How can we empowering teams with the right data, providing machine learning-driven insights and personalization? Cognitive, collaborative analytics helps teams take action in real-time, to work on the right things at the right time. Our future decision-makers will expect nothing less.

Footnote – 10 of my favourite books on Data Visualization and Presentation:

Live from SHARE: Collaborative Mainframing (revisited)

I was delayed by 24 hours getting to this week’s SHARE conference in Providence, Rhode Island – more than 10,000 miles from my home in Australia.

I was onboard my first flight from Sydney to Los Angeles when the captain announced that there was a problem with the “onboard mainframe” and they were going to have to reboot.

Now I had no idea that aircraft run on onb

oard mainframes…or whether it was actually a mainframe…or how to reboot one. Does one use CTRL-ALT-DEL? Do you just turn it off and back on again? Some wise guy onboard suggested loudly that they “Call Bill Gates.” I don’t know how much this Mr. Gates knows about mainframes. Not much it would seem, because after about two hours the captain announced that the mainframe wasn’t collaborating (he may have said cooperating, but at that point I was a little preoccupied), and the flight was cancelled.

One problem with collaboration in the workplace is that it’s often devoid of all the facts – the supporting data. Decisions are made on the basis of hearsay and assumptions, rather than empirical evidence. But if you repeat a lie, or a false assumption, often enough does it become the truth? What value do we place on facts?

There is a lot of rich, valuable data stored on mainframes that could help support fact-based decision making and avoid false assumptions. But how easy is it to get to? Because when you think about it, a mainframe without timely, easy, responsive, flexible access – a mainframe where an IT department has to extract the data and load it into some kind of data warehouse in support of the business decision-making process – is really just a glorified, multi-million dollar file server.

So, what is “collaborative mainframing?” Is it a real thing? The answer is yes!

Imagine a scenario where, as an executive, I have multiple inputs to consider as I plan my business. Some operational data may come from the mainframe, some data from external or third-party sources and be in spreadsheet format, some data may come from our budgeting systems. Now imagine I have time pressure to make a particular business decision (who doesn’t, these days?), to pull together this information, interpret it, add some context and share with my team to reach a consensus decision. How am I going to do that?

As younger people are entering the management ranks, we are seeing a shift from “management by exception” to “management by analysis”, a new breed of business user who are data savvy yet information poor. As Inhi Cho Suh, GM, IBM Collaboration Solutions recently observed: “We’re going from a typing and texting culture to a culture of conversations.” A cognitive business empowers us to work as part of a seamless flow of information and conversations. It exploits our natural inclination for teamwork and creative collaboration. Data has little value without context, but by making mainframe data more accessible in support of a more holistic business view, we can leverage these information assets like never before.

As Charles Darwin is quoted as remarking, ”It is the long history of humankind (and animal kind, too) those who learned to collaborate and improvise most effectively have prevailed.” In the increasingly complex world of today, we need ever more timely, iterative, collaborative approaches to decision-making, regardless of where our supporting information resides. If we can do this effectively, then our business really can “take flight.” THAT is the essence of collaborative mainframing.

Collaborative Mainframing

This week in San Jose, I attended my first SHARE conference, both as an attendee and as a speaker.

Having grown up in the world of business intelligence and analytics, it was interesting to get an insight into the world of the mainframe – and to meet many of the world’s leading experts in this timeless platform. During my session (“Information at the Speed of Thought — How Social Business Solutions Power Collaborative Analytics”) we had active discussions around a couple of very interesting topics:

  1. The need for curation and governance in support of self-service business decision-making;
  2. Balancing the “need for speed” in accessing and collaborating around business information with the need for security and controls around the data.

In both cases, I found it interesting to learn that the mainframe is the perfect power tool to facilitate these needs. By providing an easy mechanism to connect directly to the underlying mainframe data, visualize it, and then share it appropriately, users (including just about every bank in the world) avoid the need for a costly, time-consuming “ETL” approach with all the inherent limitations that approach introduces, including timeliness of data, effective governance and lineage of the data, difficulty keeping pace with business users’ evolving information needs, and the like.

One analogy, which seemed to resonate during my session, was the idea that finding a business insight and sharing it with colleagues should be as easy as “taking a picture and posting it on Facebook.” The increasing complexity of the world we all work in is making it imperative for us to work collaboratively to solve business problems. The old world of silos and “information hoarding” is not effective, and the information needed to support business decision-making needs to be quickly accessible, wherever it resides.

In this new world of #alternativefacts and #fakenews, it’s now more important than ever to be able to infuse business social networks with curated, governed data in support of informed, fact-based decision-making.